R4332 查看數據表(PDF) - Hamamatsu Photonics
零件编号
产品描述 (功能)
比赛名单
R4332 Datasheet PDF : 4 Pages
| |||
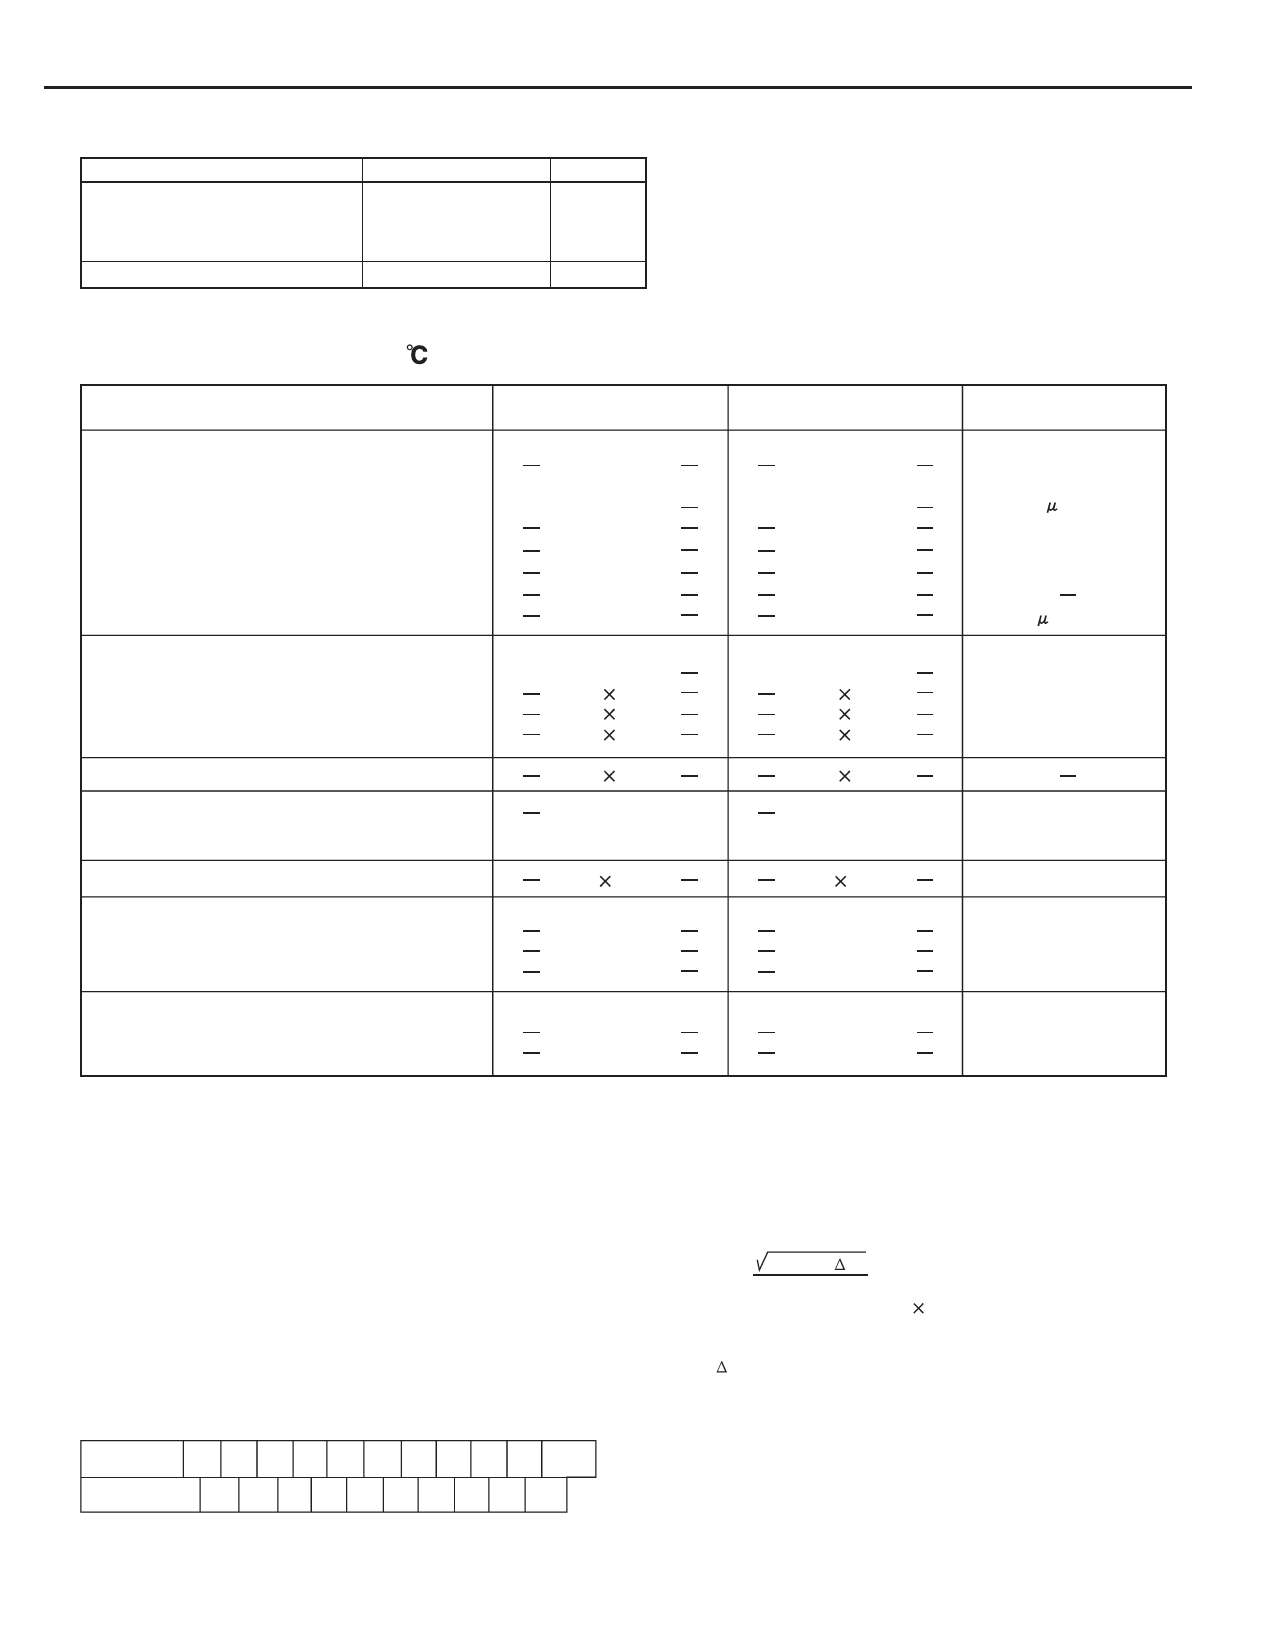
PHOTOMULTlPLlER TUBES R3788, R4332
MAXIMUM RATINGS (Absolute Maximum Values)
Parameter
Supply Voltage
Between Anode and Cathode
Value
1250
Unit
Vdc
Between Anode and Last Dynode
250
Vdc
Average Anode Current A
0.1
mA
CHARACTERISTlCS (at 25 )
Parameter
Cathode Sensitivity
Quantum Efficiency at Peak Wavelength
Luminous B
Radiant at 194nm
210nm
420nm
Red/White Ratio C
Blue D
Anode Sensitivity
Luminous E
Radiant at 194nm
210nm
420nm
Gain E
Anode Dark Current F
(After 30minutes Storage in the darkness)
ENI(Equivalent Noise Input) G
Time Response E
Anode Pulse Rise Time H
Electron Transit Time I
Transit Time Spread (TTS) J
Anode Current Stability K
Light Hysteresis
Voltage Hysteresis
R3788
Min. Typ. Max.
30
(at 250nm)
100
120
31
50
90
0.01
10
R4332
Min. Typ. Max.
40
(at 210nm)
100
120
60
68
90
0.01
10
500
1200
3.1 105
5.0 105
9.0 105
1.0 107
5
50
500
1200
6.0 105
6.8 105
9.0 105
1.0 107
5
50
1.4 10-16
2.2
22
1.2
0.1
1.0
1.4 10-16
2.2
22
1.2
0.1
1.0
Unit
%
A/lm
mA/W
mA/W
mA/W
A/lm-b
A/lm
A/W
A/W
A/W
nA
W
ns
ns
ns
%
%
NOTES
A: Averaged over any interval of 30 seconds maximum.
B: The light source is a tungsten filament lamp operated at a distribution tem-
perature of 2856K. Supply voltage is 100 volts between the cathode and
all other electrodes connected together as anode.
C:Red/White ratio is the quotient of the cathode current measured using a
red filter(Toshiba R-68) interposed between the light source and the tube
by the cathode current measured with the filter removed under the same
conditions as Note B.
D:The value is cathode output current when a blue filter(Corning CS-5-58
polished to 1/2 stock thickness) is interposed between the light source and
the tube under the same condition as Note B.
E: Measured with the same light source as Note B and with the voltage distri-
bution ratio shown in Table 1 below.
Table 1:Voltage Distribution Ratio
Electrodes K Dy1 Dy2 Dy3 Dy4 Dy5 Dy6 Dy7 Dy8 Dy9 P
Distribution
Ratio
1 1111 11111
SuppIy Voltage : 1000Vdc
K : Cathode, Dy : Dynode, P : Anode
F: Measured with the same supply voltage and voltage distribution ratio as
Note E after removal of light.
G:ENI is an indication of the photon-limited signal-to-noise ratio. It refers to
the amount of light in watts to produce a signal-to-noise ratio of unity in the
output of a photomultiplier tube.
ENI = 2q.ldb.G. f
S
where q = Electronic charge (1.60 10-19 coulomb).
ldb = Anode dark current(after 30 minutes storage) in amperes.
G = Gain.
f = Bandwidth of the system in hertz. 1 hertz is used.
S = Anode radiant sensitivity in amperes per watt at the wave-
length of peak response.
H:The rise time is the time for the output pulse to rise from 10% to 90% of the
peak amplitude when the entire photocathode is illuminated by a delta
function light pulse.
Share Link: 