HCA600ACREF 查看數據表(PDF) - Intersil
零件编号
产品描述 (功能)
比赛名单
HCA600ACREF Datasheet PDF : 11 Pages
| |||
HCA600ACREF
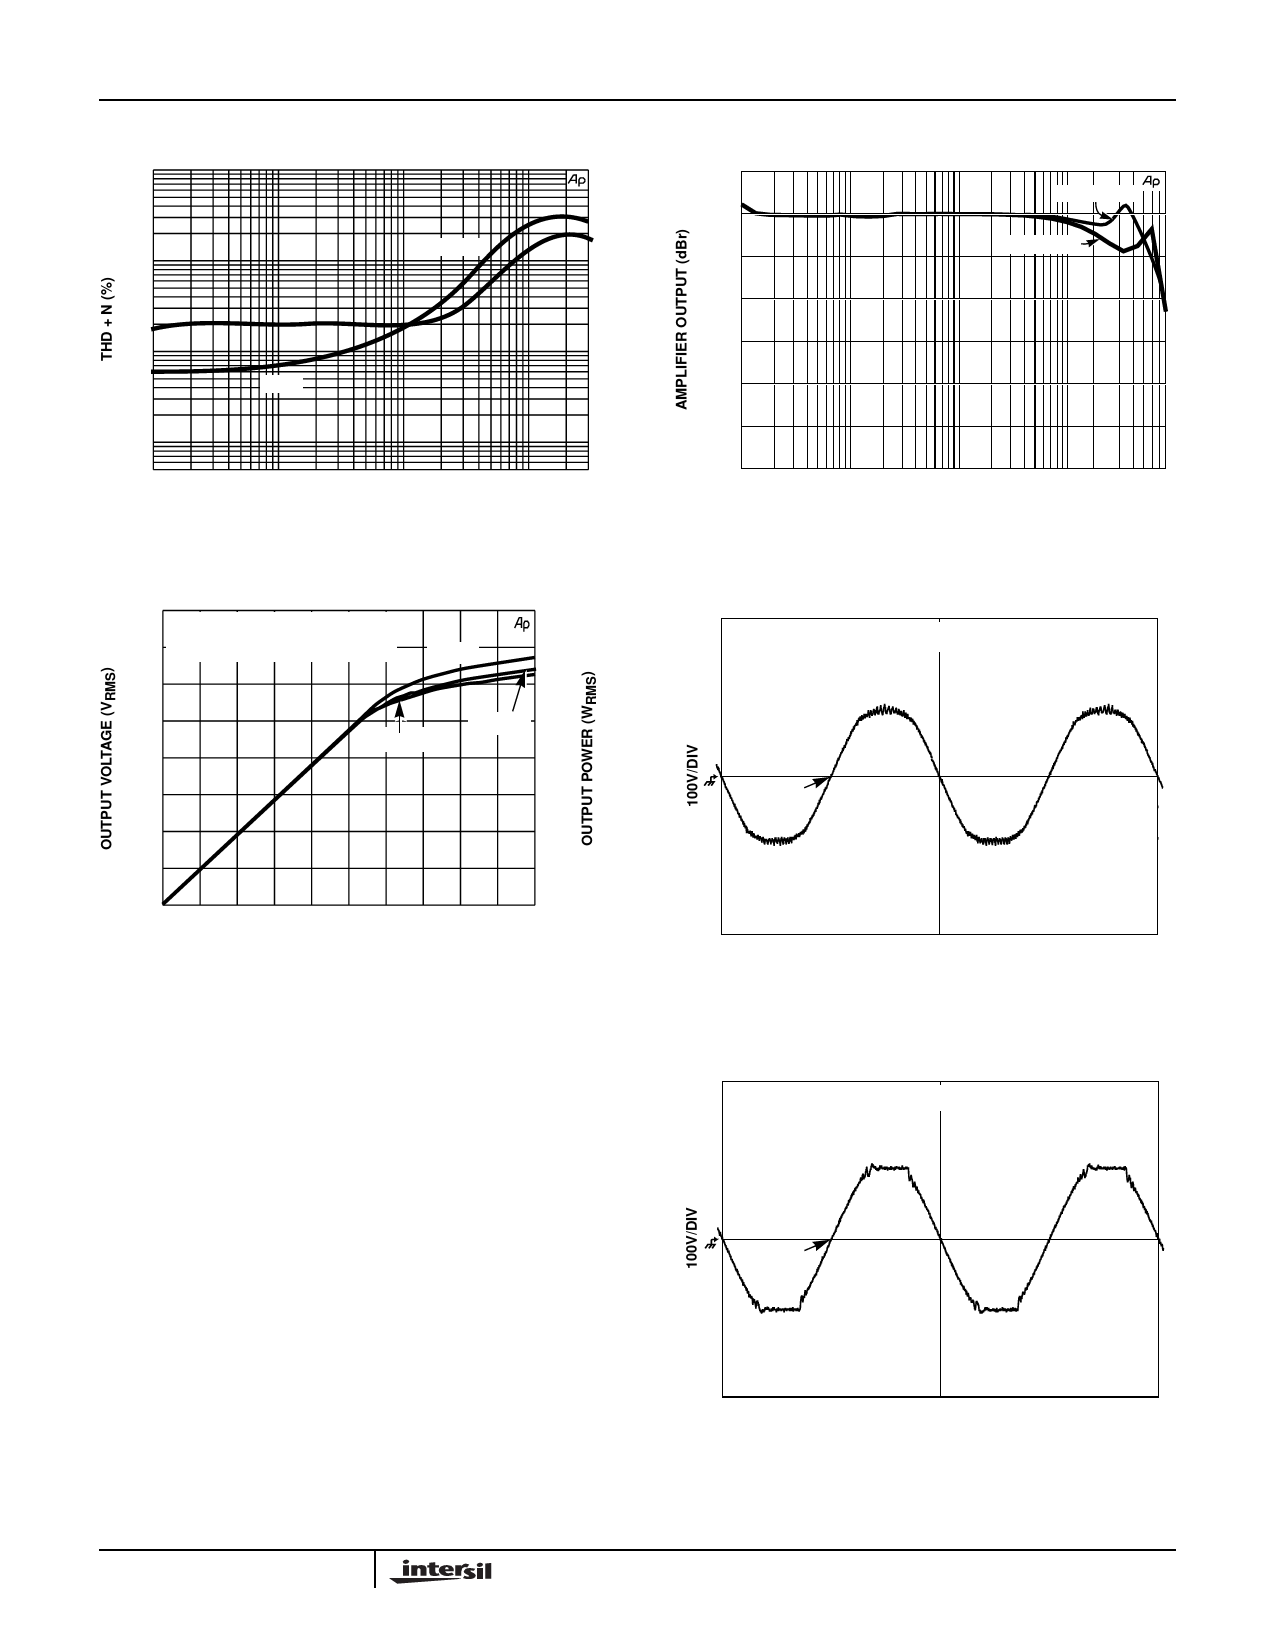
Typical Performance Curves
1
400W
0.1
0.01
20W
0.001
0.0005
10
100
1k
FREQUENCY (Hz)
10k 30k
FIGURE 1. THD +N (%) vs FREQUENCY LOAD = 8Ω
1.000
0.0
-1.000
LOAD = 8Ω
LOAD = 4Ω
-2.000
-3.000
-4.000
-5.000
-6.000
10
100
1k
10k
80k
FREQUENCY (Hz)
FIGURE 2. AMPLIFIER FREQUENCY RESPONSE
10W - LOAD = 8Ω
AMPLIFIER OUTPUT vs INPUT
90 LOAD = 8Ω
78
R= ∞
1012
760
65
R = 20K 528
R = 10K
52
338
39
190
26.0
84
13.0
21
0.0
0.0
0.0 0.6 0.12 0.18 2.4 3.0 3.6 4.2 4.8 5.2 6.0
INPUT VOLTAGE (VRMS)
FIGURE 3. AMPLIFIER TRANSFER CHARACTERISTIC WITH
VARIOUS SETTINGS OF SOFT CLIPPING
RESISTOR
Soft Clipping
Figures 3, 4 and 5 show the effects of the soft clipping
circuitry within the amplifier. Figure 3 shows the transfer
characteristic of the amplifier for various values of the soft
clipping programming resistor. An important aspect of soft
clipping is the apparent increase in sound level. As soft
clipping is reached, the upper and lower envelop of the
sinewave is gradually reduced. This “soft” rounding reduces
the higher harmonics that would result if hard clipping as
shown in Figure 5 was enabled. Soft clipping also results in
an amplifier with a more pleasing sound. Figure 4 shows the
rounding of the output with soft clipping, while Figure 5
shows the ampler output without soft clipping.
DSA 602A DIGITIZING SIGNAL ANALYZER
1ms/DIV
FIGURE 4. OSCILLOSCOPE DISPLAY OF AMPLIFIER
OUTPUT WITH SOFT CLIPPING CIRCUIT
ENABLED
DSA 602A DIGITIZING SIGNAL ANALYZER
1ms/DIV
FIGURE 5. OSCILLOSCOPE DISPLAY OF AMPLIFIER
OUTPUT WITH SOFT CLIPPING CIRCUIT
DISABLED
5
Share Link: 