AN5337 查看數據表(PDF) - Panasonic Corporation
零件编号
产品描述 (功能)
比赛名单
AN5337 Datasheet PDF : 21 Pages
| |||
ICs for TV
AN5337K
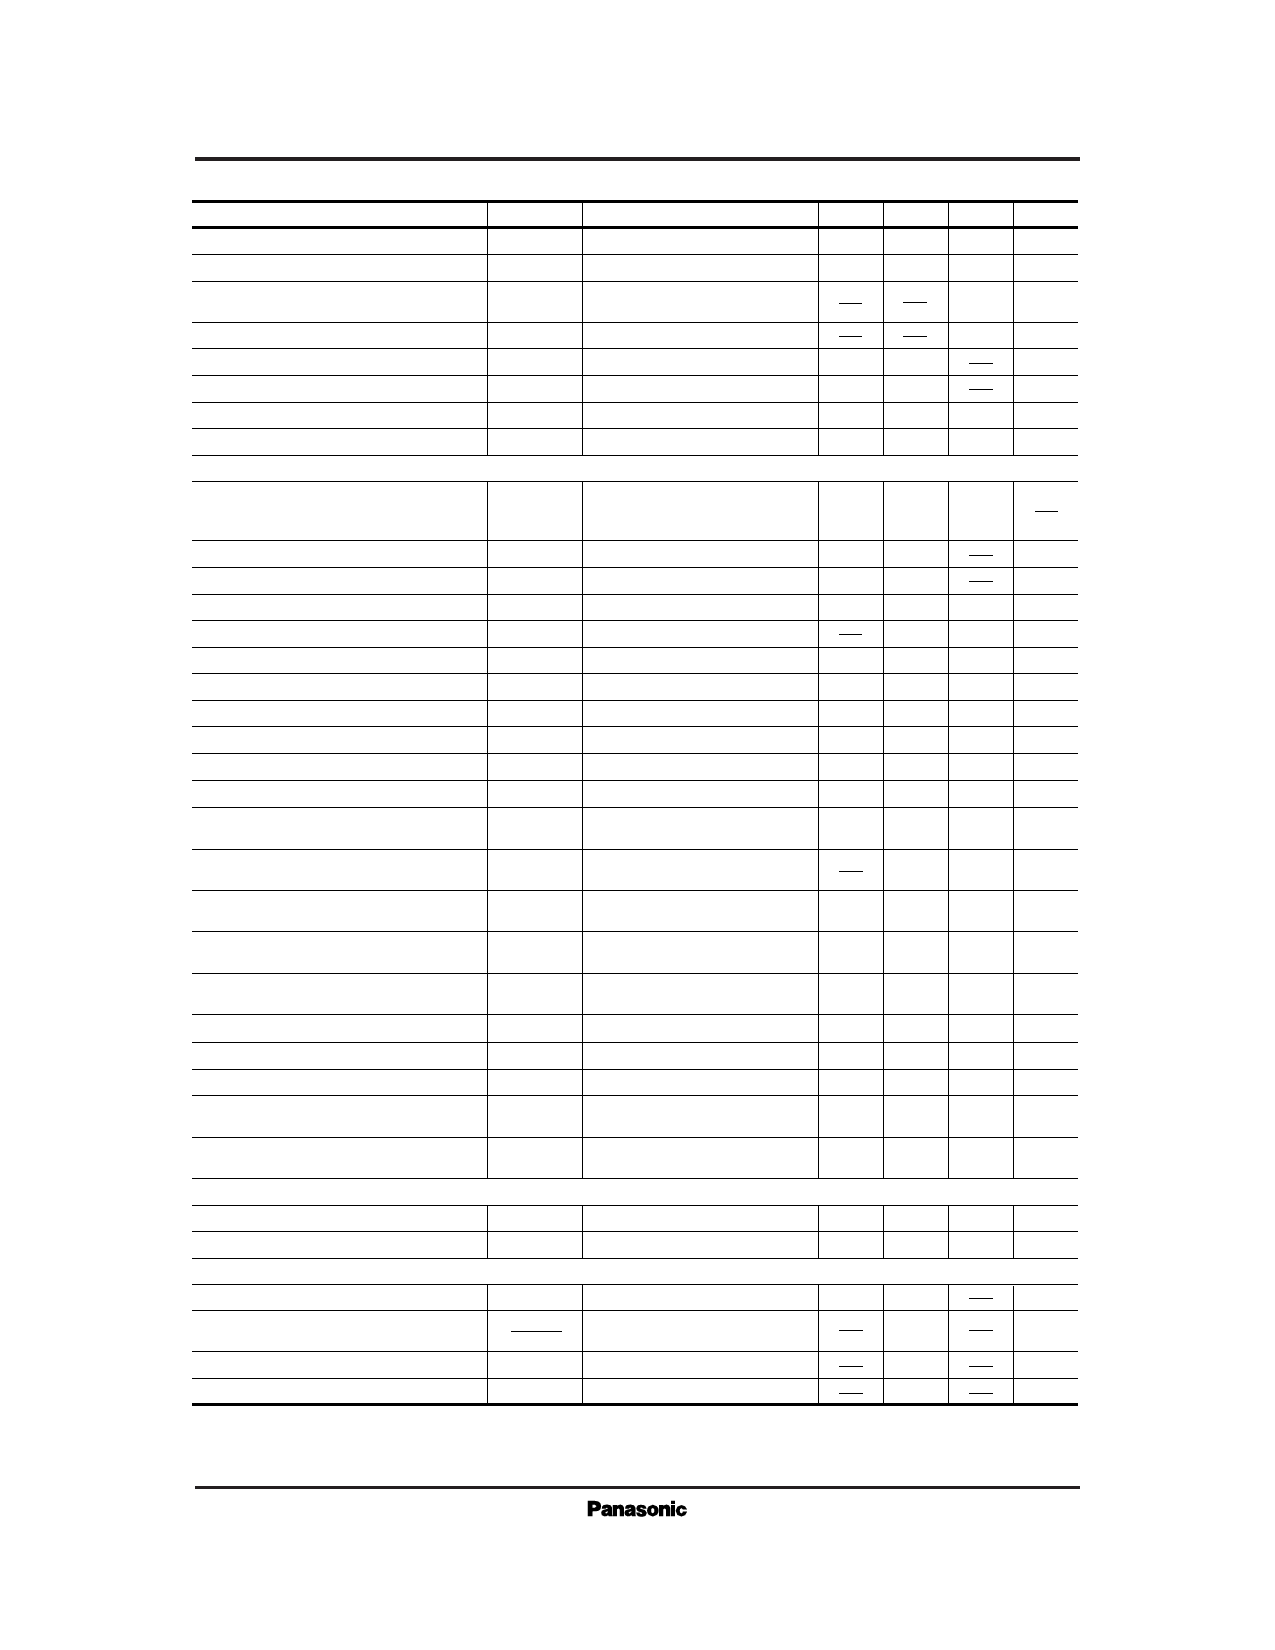
s Electrical Characteristics (cont.) (Ta= 25±2˚C)
Parameter
Symbol
Condition
min typ max Unit
Demodulation angle B–Y
Demodulation angle R–Y
Color residue
Demodulation output residual carrier
APC pull-in range Low
∠B
–5
0
5 degree
∠R
83
88
93 degree
ekiller
Killer filter terminal grounded
by 20kΩ
50 mVP–P
ecar
No signal input
50 mVP–P
fpull
Burst frequency variation
500 600
Hz
APC pull-in range High
fpull
Burst frequency variation
–500 – 600
Hz
CW output amplitude
ecw
600
800 1100 mVP–P
Free-run frequency
fco
Shift from 3.579545MHz
–200
0 200
Hz
RGB Signal Processing
Tint center
Pin25 356mVP–P
θt
Pin26 200mVP–P DAC value
[2F] [3A] [4A]
where R.B outputs are coincident
Tint variable range max. *
∆θ1
Tint : typ.→max.
40
65
degree
Tint variable range min. *
∆θ2
Tint : typ.→min.
–37 –50
degree
R–Y demodulation axis variable range *
∆θDem
Demodulation axis : min.→max.
16
28
39 degree
B–Y ratio variable range (1) *
AB–Y min. Demodulation ratio : typ.→min.
0 0.25 times
B–Y ratio variable range (2) *
AB–Y min. Demodulation ratio : typ.→max. 1.25
1.5 1.75 times
G–Y/R–Y ratio (1) *
eG/eR2
G–Y ratio change-over : 02
0.23
0.3 0.37 times
G–Y/R–Y ratio (2) *
eG/eR1
G–Y ratio change-over : 01
0.37 0.47 0.57 times
G–Y/B–Y ratio (1) *
eG/eB2
G–Y ratio change-over : 02
0.12
0.2 0.28 times
G–Y/B–Y ratio (2) *
eG/eB1
G–Y ratio change-over : 01
0.18 0.27 0.36 times
RGB output blanking voltage
EBLK
Bright : typ. cut-off
0.7
1.1
1.5
V
Color control range max. *
AB–Ycl
max.
Cont : typ.
Color : typ.→max.
3.4
5.0
6.6
dB
Color control min. value *
AB–Ycl
min.
Cont : typ.
Color : typ.→max.
25
50 mV
Color difference contrast variable range *
AB (CON)
Cont : typ.
Color : typ.→min.
3.5
6
8.5
dB
Drive control range
AR (DR)
Drive SW : 00→04
Drive : min.→max.
4
6
8
dB
Cut-off R · B control range
V (CO)
Cut off SW
Cut off : min.→max.
1.6
2.1
2.6
V
Cut-off G control range
V (CO)G
Cut-off min. to max.
0.6
1.1
1.6
V
On-screen voltage gain
On-screen contrast range
AyG
AyG (ON)
Ys=1V Contrast ; max.
Ys=1V typ.→max.
8
10
12
dB
0
1.5
3.5
dB
On-screen contrast min. value
AyG (ON)min. 0.5V input
0.1
0.3
0.5
VP–P
On-screen frequency characteristics
∆e
Attenuation quantity at f=10MHz
to f=3MHz
–6
–3
+1
dB
Deflection Signal Processing
Standard vertical output amplitude
Standard EW output amplitude
Horizontal Signal Processing
Separable sync. signal
fHO ambient temperature dependency
Vout
VEW
VIN
Input : full black sync. level
∆fHO
Ta
Ta= –20 to + 70˚C
2.2
2.6
1.8
2.2
(0.2) (1.0)
(5.5)
3.0
VP–P
2.6
VP–P
VP–P
Hz/˚C
Horizontal oscillation frequency control sensitivity
bH
AFC1 reference current (1)
I30 (1)
0D [30]
(1.2)
(0.83)
Hz/mV
mA
Note) The characteristics value in parentheses is not a guaranteed value, but reference one on design.
* The state in which R, B amplitudes and G amplitude are made coincident, is come out by means of drive I, II adjustments where
Y signal is inserted to Pin17.
Share Link: 