AN5337 查看數據表(PDF) - Panasonic Corporation
零件编号
产品描述 (功能)
比赛名单
AN5337 Datasheet PDF : 21 Pages
| |||
ICs for TV
AN5337K
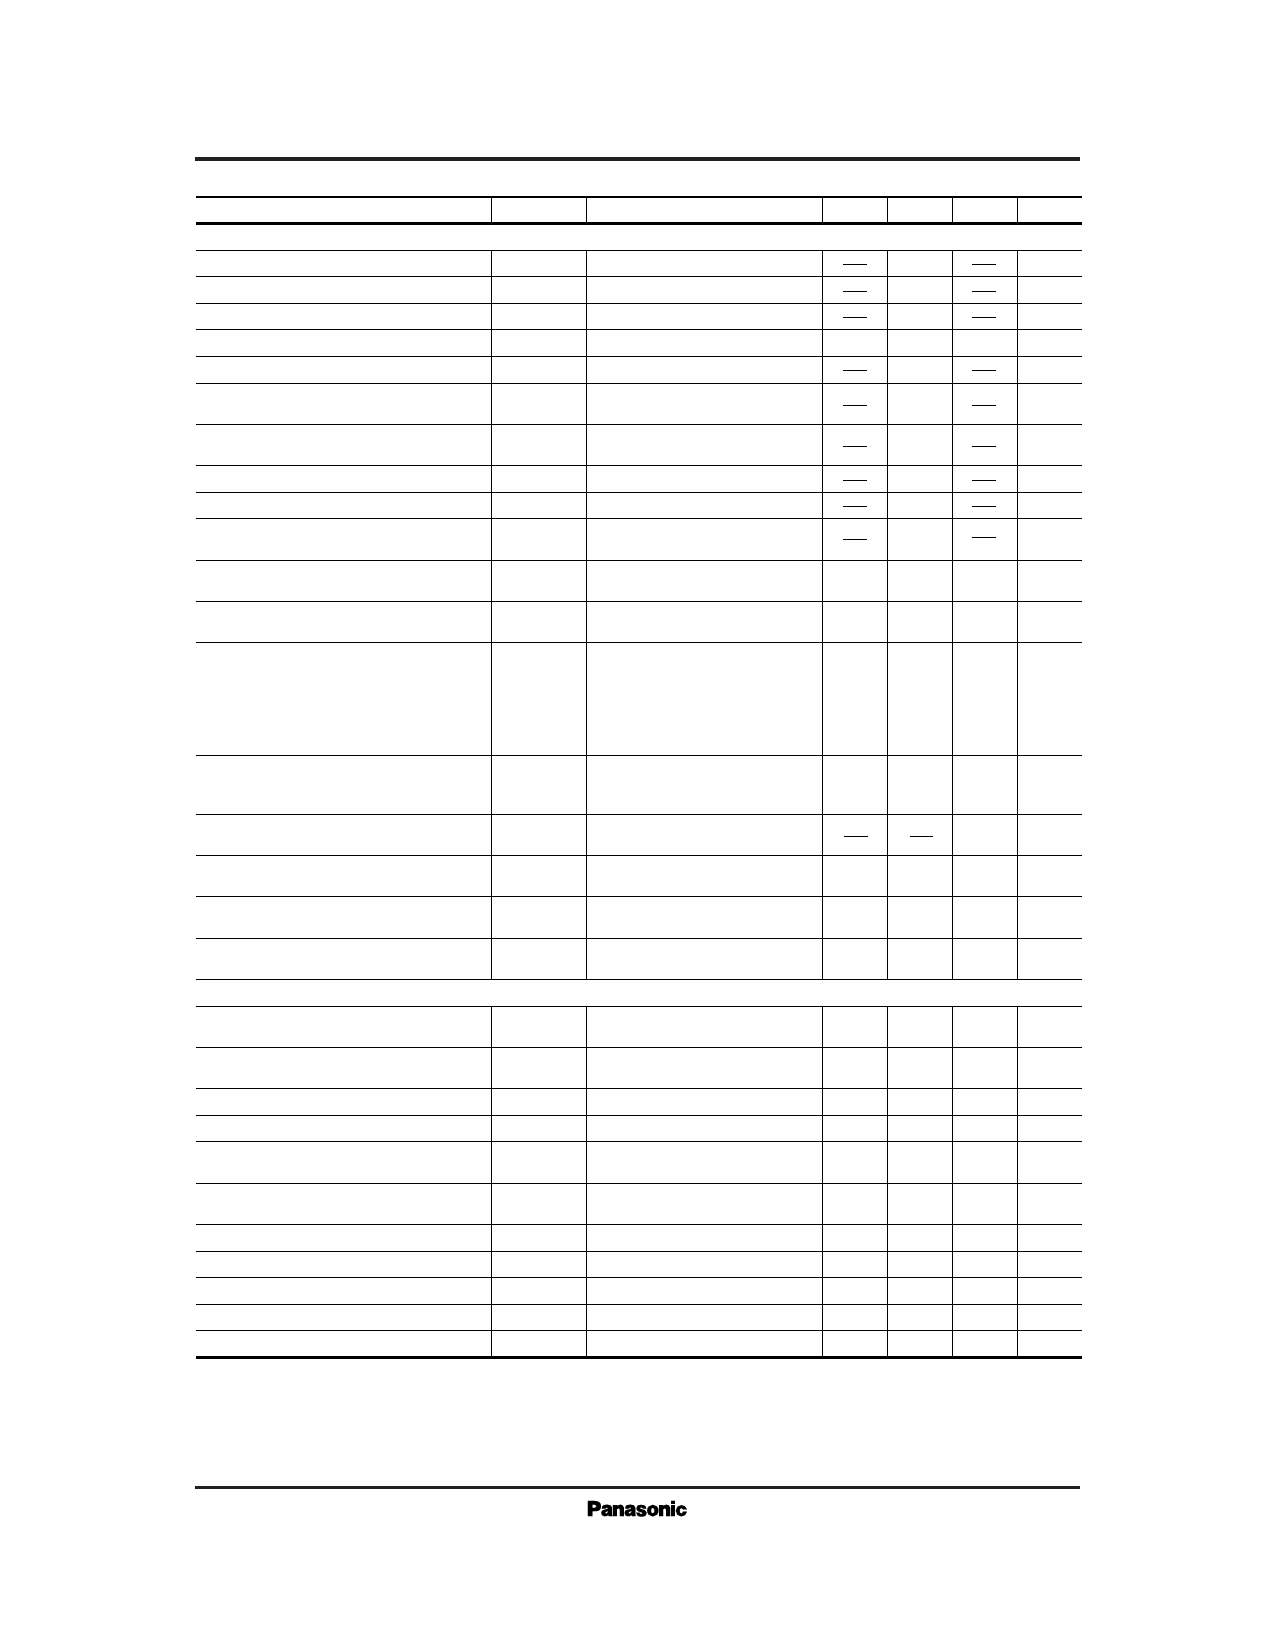
s Electrical Characteristics (cont.) (Ta= 25±2˚C)
Parameter
Symbol
Condition
min typ max Unit
RGB Signal Processing
Y→RGB crosstalk
RGB→Y crosstalk
Color difference input dynamic range
eCT1
eCT2
AVmax.
Crosshatch
Crosshatch
(– 45)
dB
(– 40)
dB
(2.2)
V
Internal external pedestal difference voltage
OSD input dynamic range
∆E (YS)
AVmax.
(–100)
(0) (100)
mV
(1.5)
V
RGB output amplitude VCC dependency ∆eG (VCC)
OSD output amplitude VCC dependency
RGB color difference amplitude temperature dependency
OSD output amplitude temperature dependency
Color control range (External)
∆eg (VCC)
∆eG (Ta)
∆eg (Ta)
∆ecolor
VCC1 8.5 to 9.5V
VCC2 4.5 to 5.5V
VCC1 8.5 to 9.5V
VCC2 4.5 to 5.5V
–20 to +70˚C
–20 to +70˚C
øE : [40]
Control ratio to DAC
(0.4)
V/V
(0)
V/V
(20)
%
(6)
%
(28)
%
White character slice level range
VW
Blooming DC2.5V
Color difference no input
(0.6) (0.8) (1.0)
V
White character correction range
C/Y ratio
∆VW
Blooming DC2.5V
Color difference no input
Y : 0.36VB –W
C : Color bar standard
VC/Y
Color : typ.
Contrast : typ.
G–Y/Y zero peak ratio at
G output
(0.6) (0.8) (1.0)
V
(0.23) (0.36) (0.56) times
Pedestal variation at OSD contrast
R–Y/B–Y ratio
Color track OFF/ON *
variation (1) Blue
Color track OFF/ON *
variation (2) Red
Color track OFF/ON *
variation (3) Yellow
Deflection Signal Processing
∆E (cont)
eR/eB
∆eBB
∆eBR
∆eRY
YsL, YsH (BLK period low)
output DC difference
Contrast : 1E – max.
Pin25 ; 356mVP–P
Pin26 ; 200mVP–P
B –Y1.39V, R–Y1.1V,
After tint and color adjustment
Color track ON
Variation quantity at øE : 03→04
(–200)
(–160)
(–240)
(0) (200)
(1.0)
(0) (160)
(– 40) (–160)
(–350) (–200) (–16)
mV
times
mV
mV
mV
Vertical amplitude variation ratio
Vertical linearity variation width
∆Vamp
∆Vlin
Vertical amplitude
typ.→max., min.
Vertical linearity :
typ.→max., min.
(–15) (±22) (±30)
%
(±8) (±12) (±19)
%
Vertical S-correction amplitude variation ratio ∆Vsc
Vertical S correction : max.→min. (–33) (–19) (–5)
%
Vertical position variation width
∆Vshift Vertical position : min.→max. (0.6) (0.8) (–1.0)
V
Vertical EHT correction amplitude variation ratio ∆VEHT
Pin62= 0V, Vertical EHT :
typ.→max., min.
(±7) (±11) (±15)
%
EW parabola variation width
∆V
parabola
EW parabola amplitude :
min.→max.
(2.8) (4.1) (5.4) VP–P
Horizontal amplitude variation width
∆VH–WIDTH Horizontal amplitude min.→max. (3.4) (4.6) (5.8)
V
Horizontal amplitude MIN DC value
VH–WIDTH
(1.5) (1.9) (2.3)
V
Trapezoidal distortion correction variation ratio ∆VTrapz
Trapezoidal distortion correction : typ.→max., min. (±48) (±72) (±96)
%
Corner correction variation ratio 1
∆Vcorner EW corner–1 : min.→max.
(– 40) (–28) (–16)
%
Corner correction variation ratio 2
∆Vcorner EW corner–2 : min.→max.
(–38) (–26) (–14)
%
Note) The characteristics value in parentheses is not a guaranteed value, but reference one on design.
* The state in which R, B amplitudes and G amplitude are made coincident, is come out by means of drive I, II adjustments where Y
signal is inserted to Pin17.
Share Link: 